Notes on Projection 1.0
Table of Contents
Notes on Projection 1.0:
SQL Query of any player's matches
I don't know if Tafokints has some sort of system like this but if he doesn't he should definitely consider it - it's very handy to have matches in this sort of format because you can get all sorts of information really easily
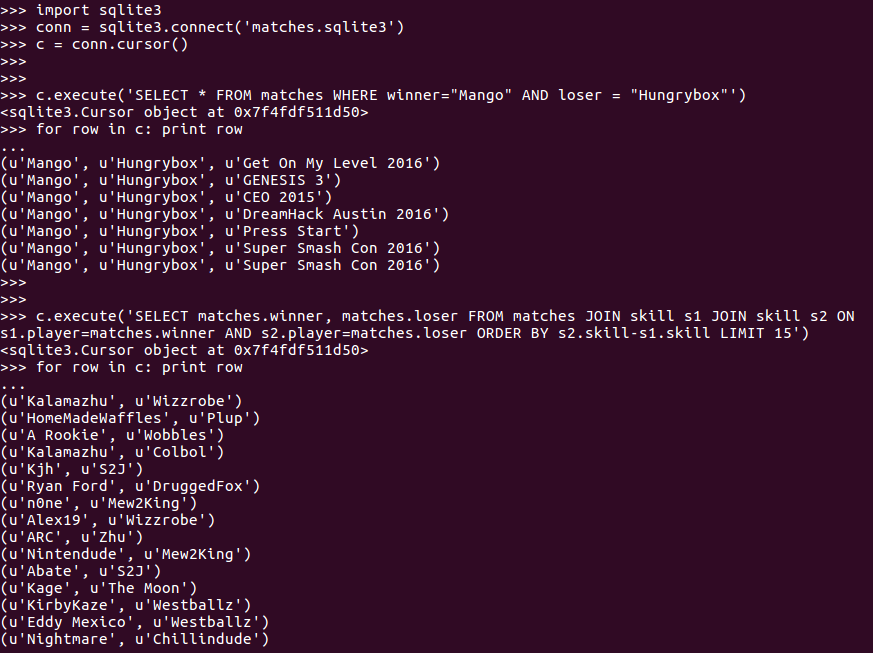 Making this information publically available in some sort of app would
be super useful - I frequently talk with friends about who's beaten who
recently and trying to find all of Silent Wolf's bracket matches against
fox players is a gigantic pain (and is now super simple with this
database)
Assigning People Skill
This is one of the shakier parts of this project, so I tried to make the bins fairly large to compensate for the fact that I'm not 100% super familiar with every single player's skill level. Like I said, this is basically a giant demo and there are a number of things that this can be replaced with in a production environment, so please don't approach me all upset that player X is in tier Y and should really be in tier Z because I promise I will do literally nothing about it.
Winrate In Melee vs In Sports
Eli Ben-Naim et al. 2006 did a similar analysis with a bunch of different sports:
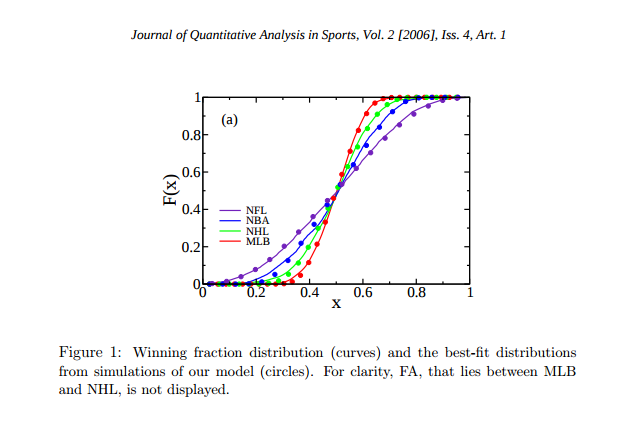 It's a pretty good read if you're interested in sports statistics, but
if you want a quick comparison to Melee then the tl;dr is that Melee's
upset rate is similar to the NFL upset rate (~36%) and overall is a tad
on the conservative side on the spectrum of traditional sports.
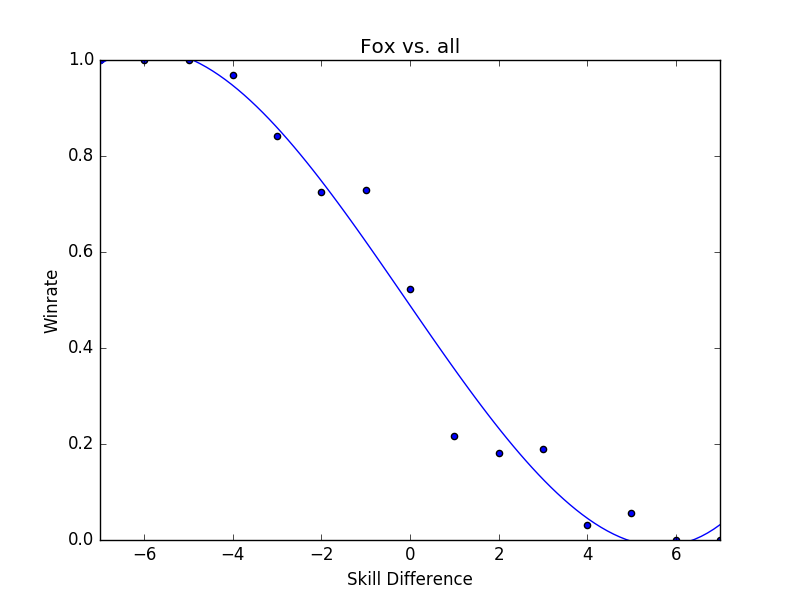
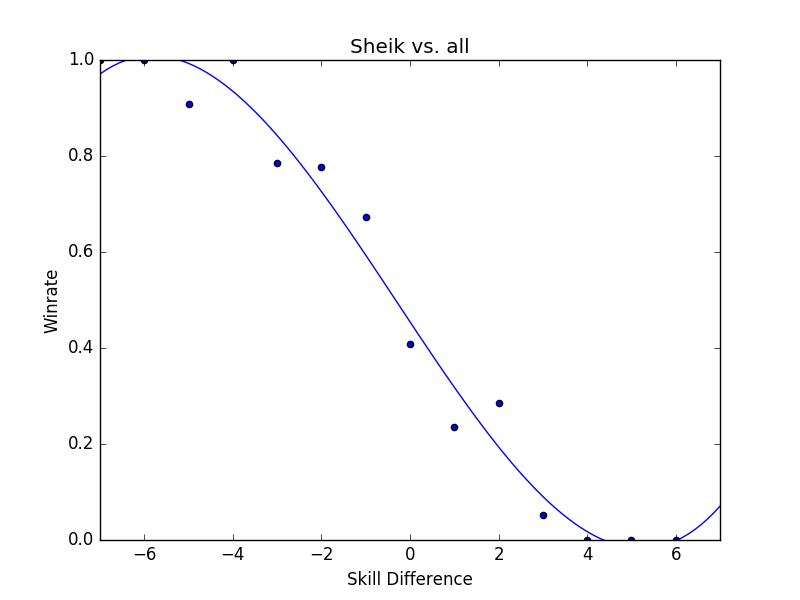
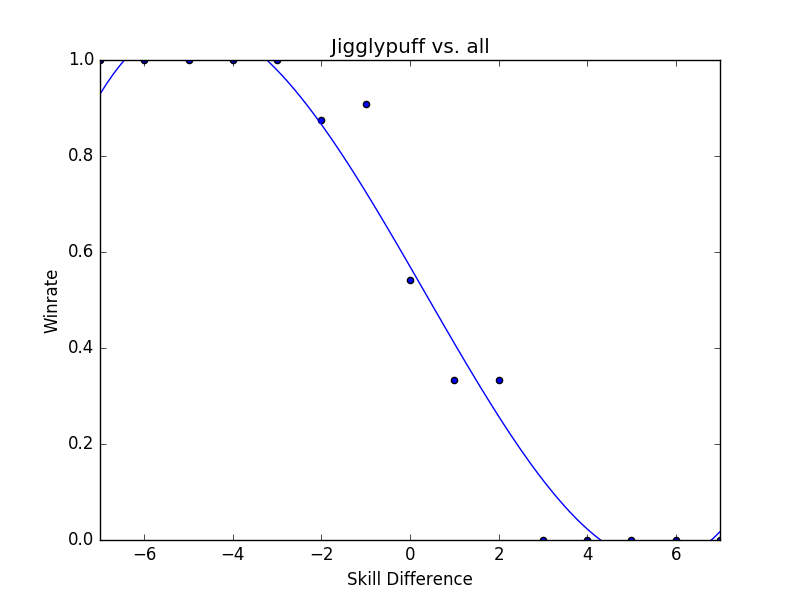
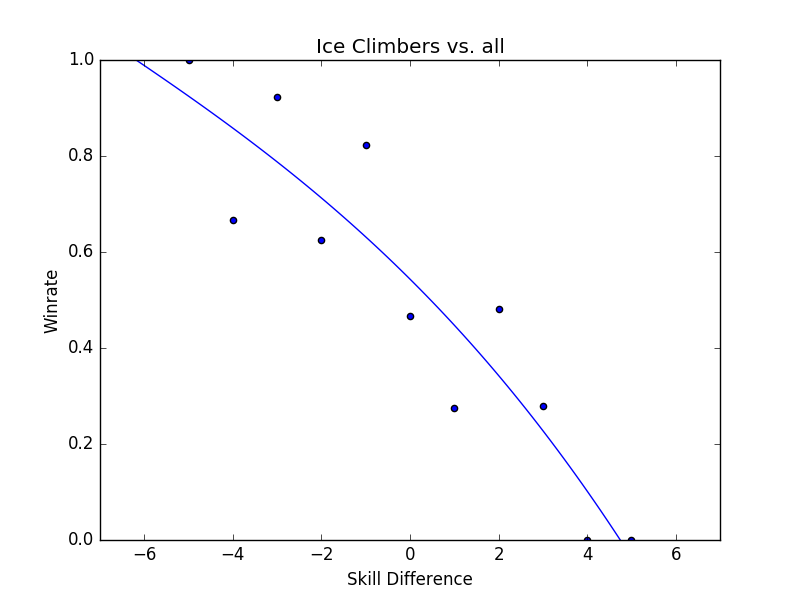
Global Character Curves
Dumped here to not take up too much space on the actual writeup
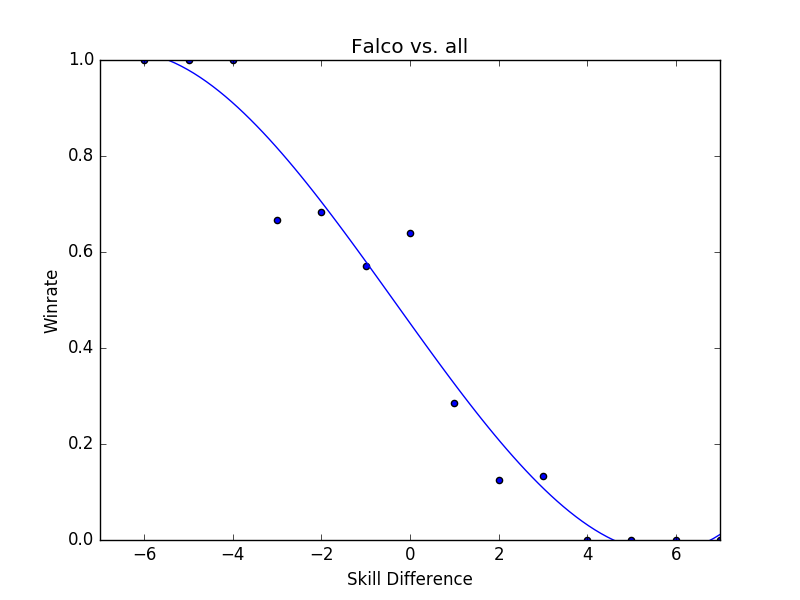
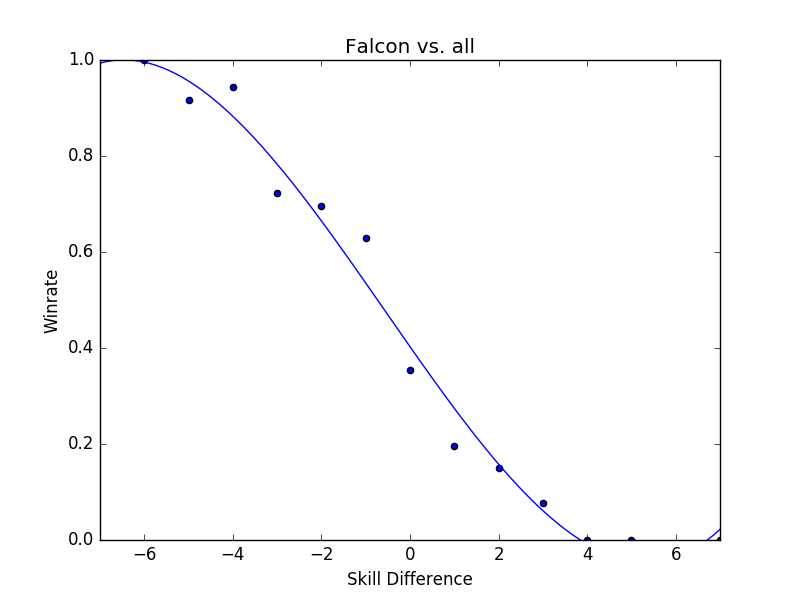
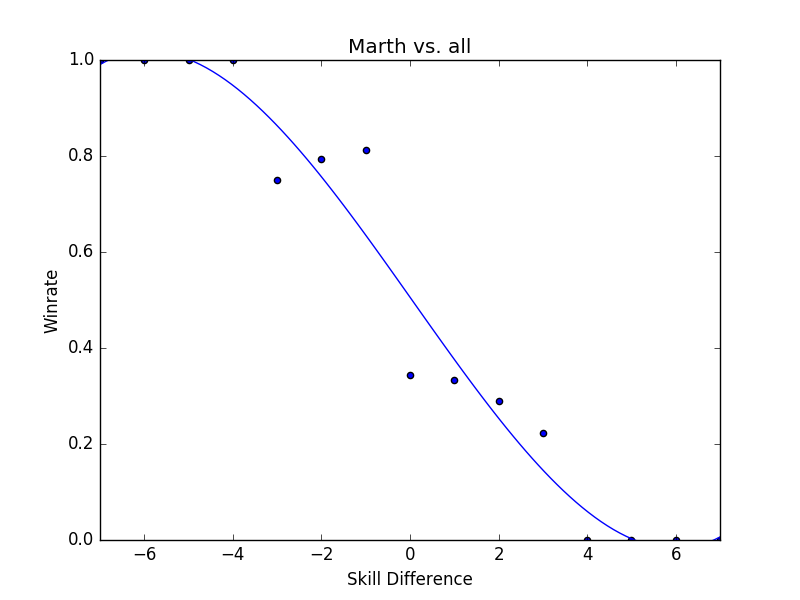
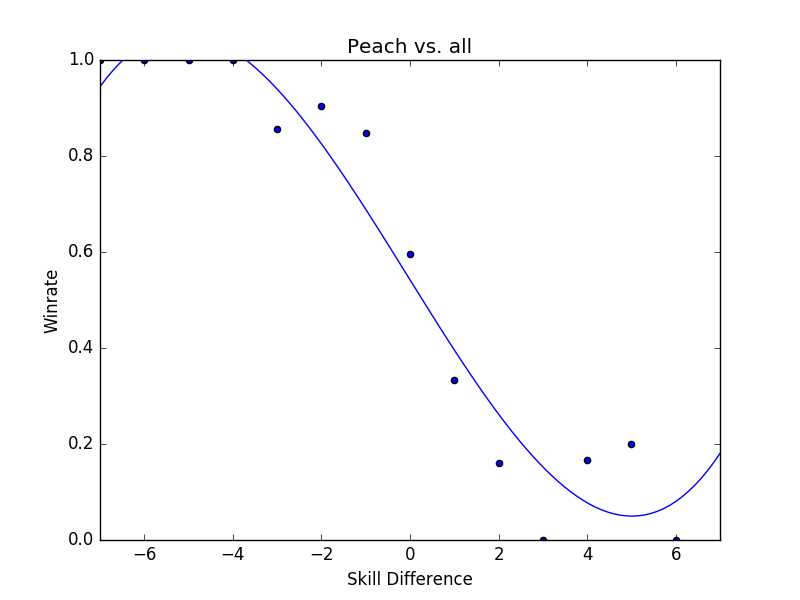
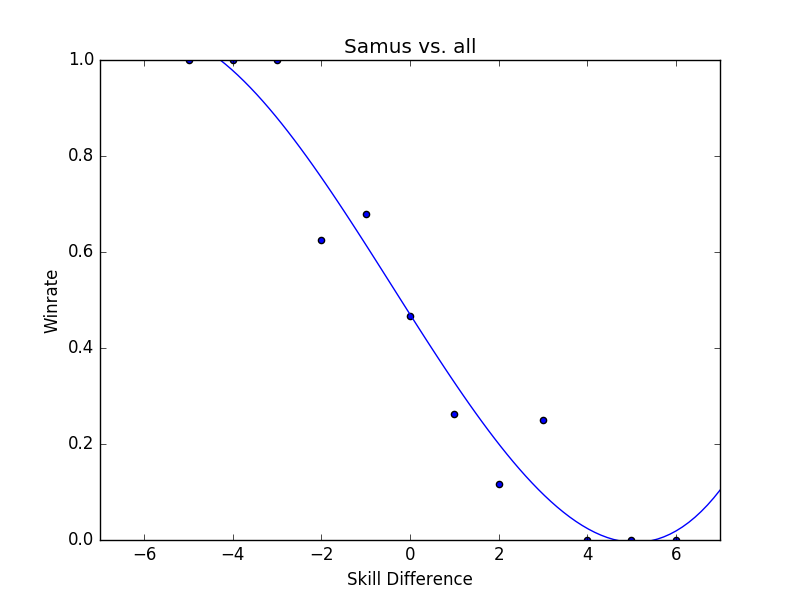
Matchup Curves
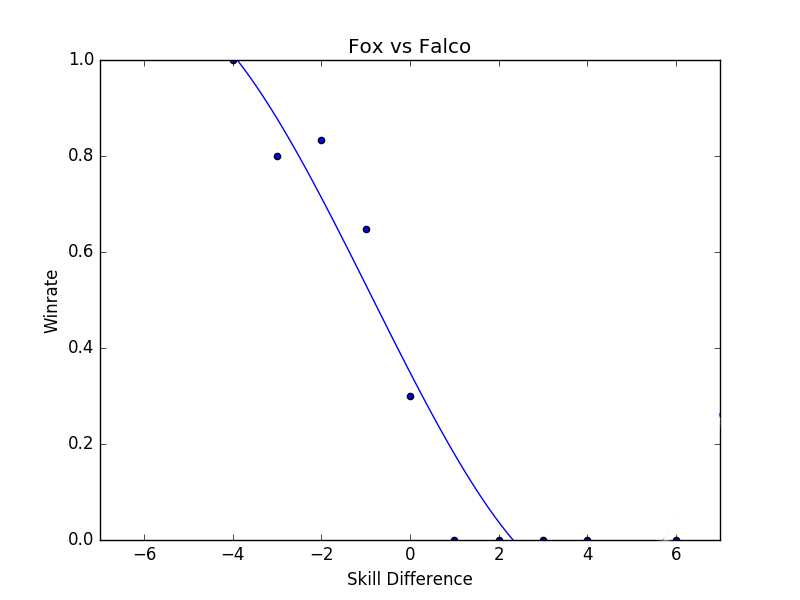
A very many of these simply didn't have enough data to be useful - here's a few of the ones that at least made some sense.
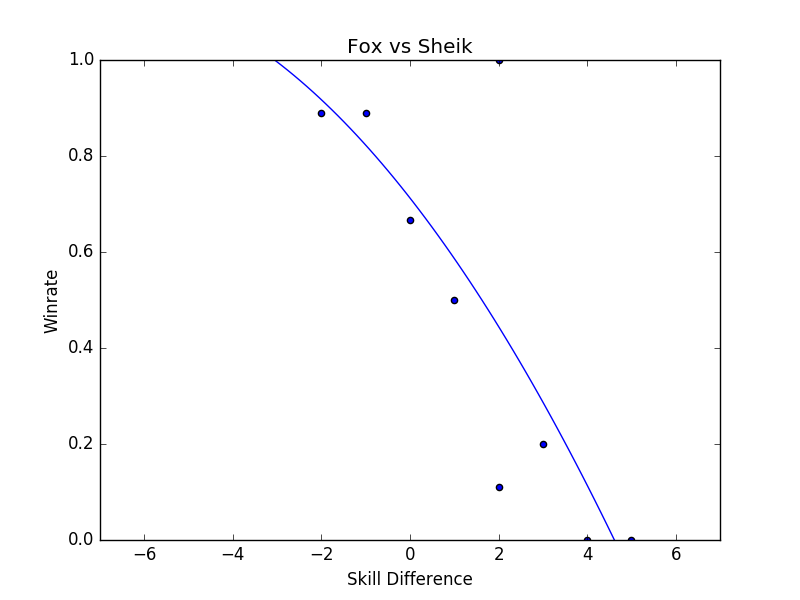
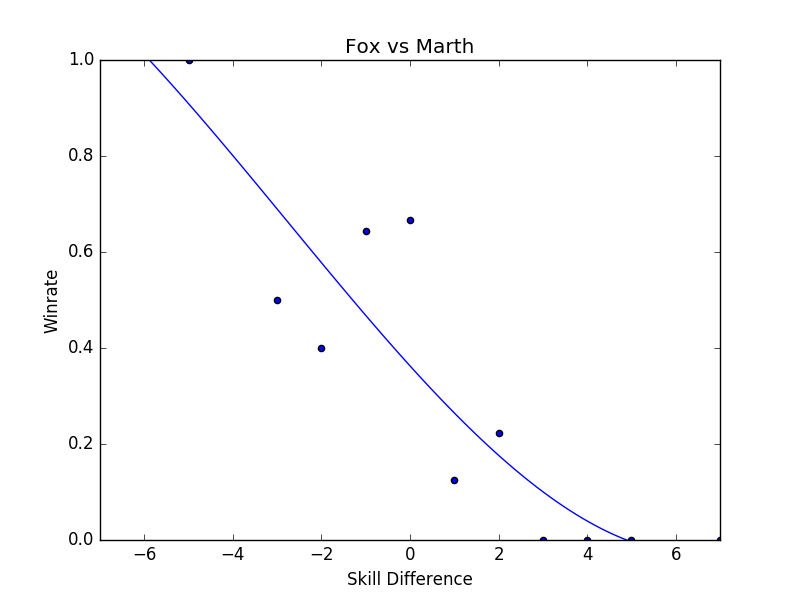
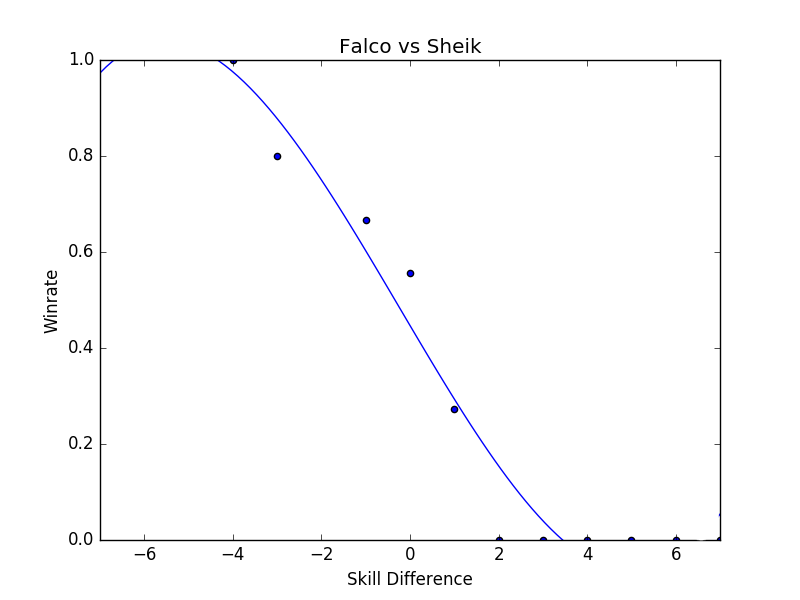
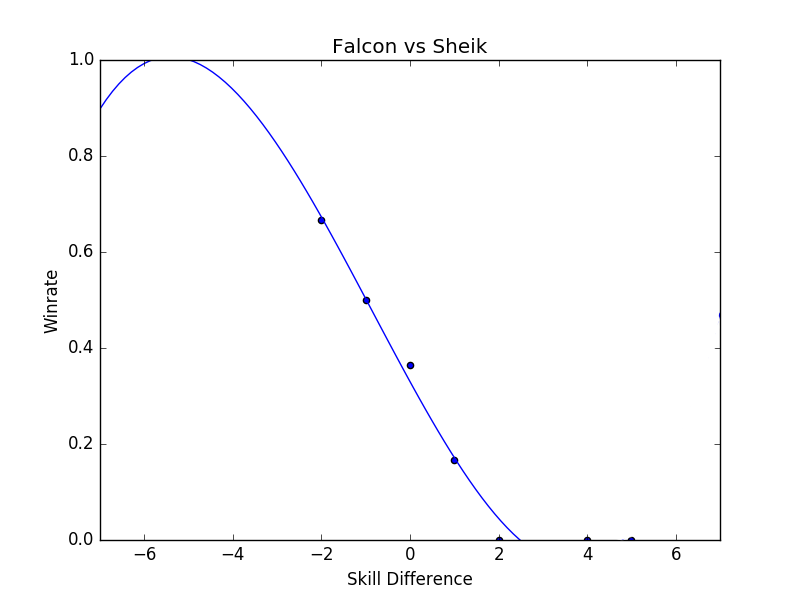
Trendlines
Part of the reason I wasn't super comfortable using much data from these curves, especially for character vs character, is because I wasn't super knowledgable about trendlines and I wasn't particularly thrilled with the way they turned out. If I want to improve this I'll need to learn more about trendlines, weight the trendlines based on which points have the most matches played (since a point with 80 matches and a point with 1 match are weighted equally with a normal trendline). I also need to figure out how to apply more specific rules to trendlines (e.g. must always be increasing or staying the same, must begin at 1 and end at 0, etc) because the fact that these curves slope downwards at the ends sometimes is definitely not what I wanted.
Volatility - Characters and Matchups
This applies the integral that I mentioned on the global character curve:
| Character | Consistency | Upset |
|---|---|---|
| Puff | 91% | 14% |
| Peach | 89% | 17% |
| Samus | 85% | 12% |
| Marth | 85% | 15% |
| Fox | 84% | 14% |
| Sheik | 83% | 11% |
| Ice Climbers | 81% | 20% |
| Falco | 81% | 12% |
| Falcon | 79% | 10% |
Decision Tree Classifier
The classifier is a simple one that just follows a series of rules, but just because it's a simple idea doesn't mean it won't have a complicated execution
Features
I was originally gonna throw in "Winrate vs opponent's character" as a feature but it worked better than I had hoped with just the features I put in and I was worried about overfitting the data, so I just left it alone to prevent additional complications. I'll probably play around with it some more eventually but for now this is fine.
Radar Chart
Full Disclosure - I didn't use matplotlib for this, I just found a tool online to do it. You can use matplotlib for this but actually finding good places to put these values is another task in and of itself (I tried to place it as "would have a 50% winrate vs players of this skill" which would likely be an entirely seperate problem solved probably with linear regression or something) so I just made one as a sort of mockup.